
Contents
Investors in the USDJPY pair are closely monitoring multiple market indicators to make informed trading decisions. Two of the key indicators in focus are the Relative Strength Index (RSI) and the Moving Average Convergence Divergence (MACD).
Market Indicators and Their Signals
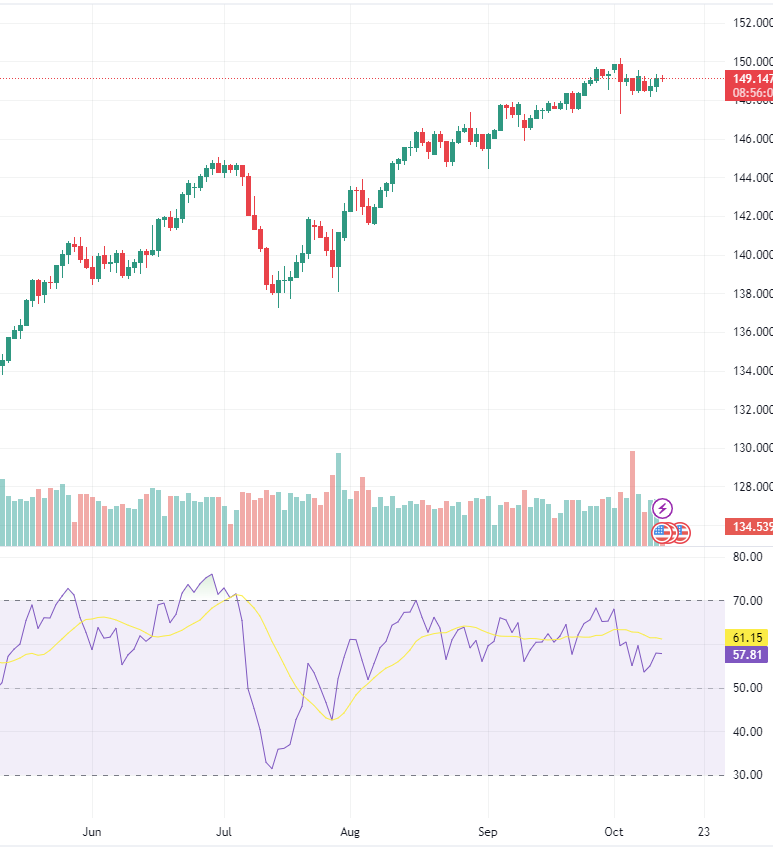
- RSI and MACD Analysis: The Relative Strength Index (RSI) measures the strength of a price trend and its potential reversal points. An RSI above 50 typically suggests a bullish sentiment, while an RSI below 50 might indicate a bearish sentiment. In the case of USDJPY, the RSI, although still above the 50 mark, continues to trend downward. Traders use the Moving Average Convergence Divergence (MACD) as another popular indicator to identify potential changes in trend direction. They interpret a bearish signal when the MACD crosses below its signal line, while a crossover above the signal line is considered a bullish signal.In this scenario, the MACD is decelerating below its red signal line, adding to the uncertainty in the market.
- Candlestick Patterns and Their Significance: The candlestick chart, a popular tool in technical analysis, can provide valuable insights into market sentiment. In the USDJPY analysis, the candlestick arrangement near the uptrend’s high resembles a bearish hanging man pattern. This formation suggests that the market might be on the verge of a downturn. Traders often use such patterns to anticipate potential price reversals.
USDJPY Support and Resistance Levels
Understanding support and resistance levels is crucial for traders to identify potential price turning points. In the case of USDJPY, the 20-day simple moving average (SMA) at 148.75 serves as a key support level. A breakdown below this level at 148.75 could open the door for a decline. The next support level is situated near the 50-day SMA at 147.27, which is complemented by the nearby 23.6% Fibonacci retracement level. Conversely, the resistance levels at 150.75 to 151.65 represent significant barriers. Breaking through these resistance levels carries a significant potential for the pair to gain upward momentum.Such a breakthrough could, in turn, lead to a test of the 2022 high and further resistance levels.
In summary, the market indicators and support/resistance levels are crucial elements that traders are considering in their analysis of USDJPY. The upcoming release of the US Consumer Price Index (CPI) data adds an additional layer of complexity and anticipation to this analysis, making it a noteworthy event for investors in the forex market.
read more: Federal Reserve Expresses Uncertainty in Recent Policy Meeting
For beginners: What is CPI (Consumer Price Index)?
For beginners and those unfamiliar with the concept, the Consumer Price Index (CPI) is a fundamental economic indicator used to gauge changes in the cost of living over time. It measures the average price variations paid by consumers for a basket of goods and services, which typically includes items like food, housing, clothing, transportation, and more. Governments, central banks, and financial analysts often use CPI as a vital tool to assess inflation, enabling them to make informed decisions and formulate economic policies.
A rising CPI indicates that, on average, the prices of these essential goods and services are increasing, signifying inflation. On the other hand, a declining CPI suggests deflation, meaning that prices are generally decreasing. Investors pay close attention to the CPI figures as they can have a significant impact on financial markets, including currency exchange rates, stock prices, and interest rates.
In the context of the USDJPY analysis mentioned above, traders are eagerly awaiting the release of September’s US CPI data as it can provide crucial insights into the potential future direction of the currency pair. If the CPI data exceeds expectations, it may exert upward pressure on the USDJPY exchange rate, while disappointing CPI figures could weigh on the dollar’s value against the yen. This is why investors closely monitor the CPI report as part of their market analysis.
Do you need help in finding the best forex broker for your needs? Click here: Best Forex Broker
Disclaimer:
Please note that this article serves solely for informational purposes. Thus, must not construe as financial advice. We advise readers to conduct thorough research and consult with financial professionals before making any investment decisions.