Contents
- 1 Core PCE Deviation and September Report Implications
- 2 Core PCE: Detailed Analysis of Contributors to Q3 GDP Growth
- 3 Strong 3Q Growth in Final Domestic Demand: A Key Indicator with Core PCE Falls fact
- 4 Ongoing Five-Quarter Trend: Consensus vs. Actual Outcomes
- 5 Robust Economic Indicators: Weekly Claims and Capital Goods Orders
- 6 Chairman Powell’s Views on Strong GDP Growth and Inflation Risks
- 7 Disclaimer:
Core PCE Falls and US Economy was the headline of A plethora of significant data releases occurred simultaneously this morning. encompassing information from the European Central Bank (ECB), various United States economic indicators, and more. This convergence of data complicates the process of arriving at definitive conclusions regarding market reactions. Nevertheless, it appears plausible that following the release of the 8:30 am Eastern Time U.S. data,U.S. Treasury yields declined due to market emphasis placed on a minor shortfall in core Personal Consumption Expenditure (PCE) inflation, while simultaneously discounting the positive performance of the third-quarter Gross Domestic Product (GDP) and its impressive details. From the perspective of Federal Reserve narrative analysis, I maintain reservations about the precision of this interpretation.
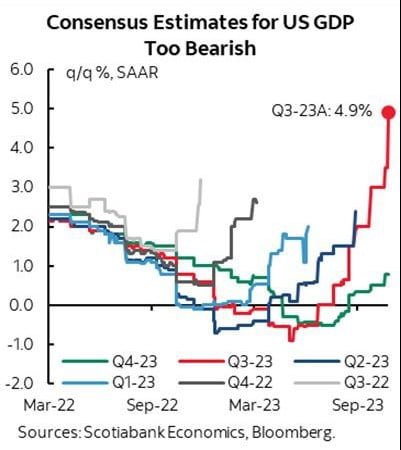
The third-quarter GDP exhibited a quarter-over-quarter growth rate of 4.9% seasonally adjusted at an annual rate (SAAR). Surpassing consensus expectations and exceeding the lower boundary of consensus estimates, which also incorporated the projection by Scotiabank Economics. This growth denoted a significant acceleration, reaching the highest level since the fourth quarter of 2021.
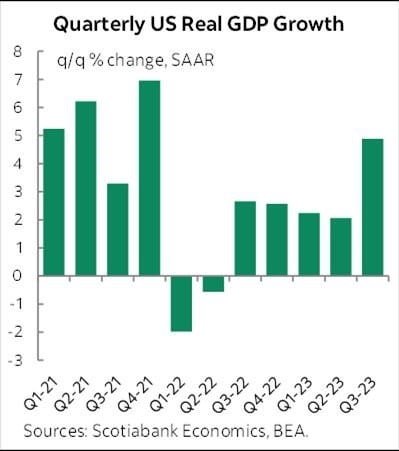
Core PCE Deviation and September Report Implications
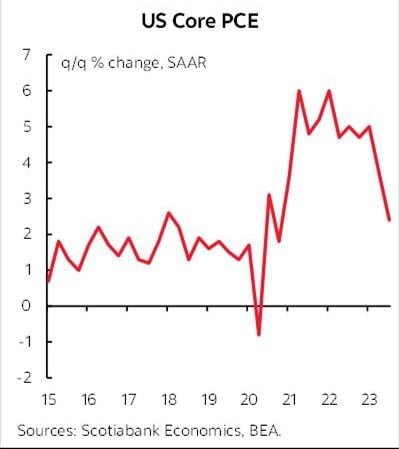
On the contrary, core PCE recorded a minor deviation from consensus forecasts, settling at 2.4% SAAR quarter-over-quarter. It remains unclear whether this deviation emanates from revisions to prior months or signals an anticipation of weaker core PCE readings for the forthcoming September report. A comprehensive assessment of inflationary pressures, as per the Federal Reserve’s preferred gauge, necessitates the evaluation of tomorrow’s data. Now the second chart predominantly reaffirms known trends linked to the softer patch in monthly core PCE readings when overlaid on the third-quarter tally.
Core PCE: Detailed Analysis of Contributors to Q3 GDP Growth
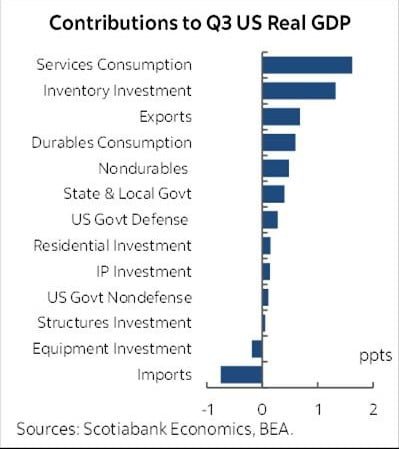
The third chart provides a detailed breakdown of Q3 GDP contributors. Consumption added 2.7 percentage points, with services at 1.6 and goods at 1.1. Investment had a minor impact, contributing 0.2 points, with nonresidential investment flat. Equipment investment detracting 0.2 points, and residential investment adding 0.2 points. Inventories contributed 1.3 points, primarily from nonfarm inventories. Even without inventories, growth remained robust. Net trade had a slight negative effect of -0.1 points, as exports added 0.7 points, while imports subtracted 0.75 points. This may be linked to increased imports, possibly for holiday season inventory buildup. Government spending contributed 0.8 points, equally split between Federal and state/local governments.
Strong 3Q Growth in Final Domestic Demand: A Key Indicator with Core PCE Falls fact
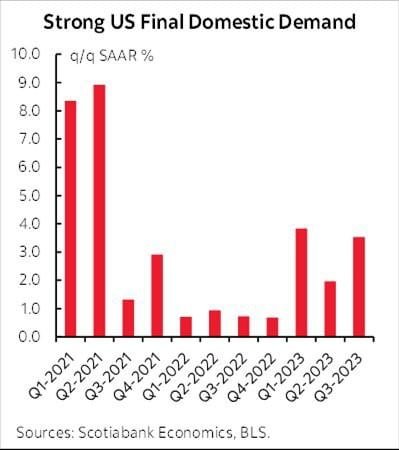
With Core PCE Falls facts comes Final domestic demand exhibited substantial growth in the third quarter, with a quarterly gain of 3.5% SAAR. Notably, final domestic demand comprises consumption, government spending, and investment, excluding inventories and net trade. While these excluded components remain pertinent, the strength in final domestic demand offers a valuable cross-check on the robustness of the domestic economy in the last quarter.
Ongoing Five-Quarter Trend: Consensus vs. Actual Outcomes
Today’s data releases extended a five-quarter trend wherein consensus expectations, at the outset of each quarter, anticipated an impending downturn, only to revise growth estimates upward throughout the quarter and, ultimately, fall short of the actual outcomes. There is emerging evidence suggesting a recurrence of this pattern in the fourth quarter.
Robust Economic Indicators: Weekly Claims and Capital Goods Orders
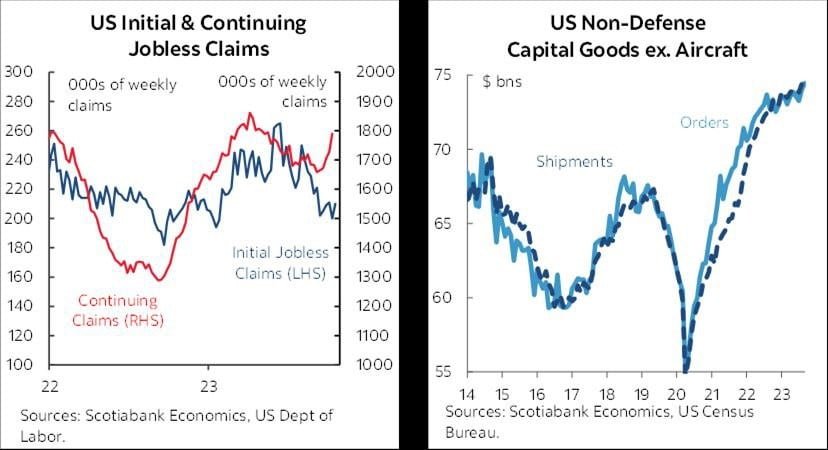
Simultaneously, weekly claims remained at a low of 210,000 last week. That following a reading of 200,000 in the prior week, and U.S. capital goods orders exhibited notable strength. Core orders, excluding defense and aircraft, rose by 0.6% month-over-month in September and were revised upward to 1.1% month-over-month in August, up from 0.9%. Total durable goods orders increased by 4.7% month-over-month seasonally adjusted, surpassing the consensus forecast of 1.9%. Business investment displayed vitality in September.
Also Read: US Markets Analysis and ECB’s Dilemma
Chairman Powell’s Views on Strong GDP Growth and Inflation Risks
With the fact that the market has not kept up with expectations. Also Core PCE Falls. Chairman Powell’s argument comes to focus on the idea that continued strong GDP growth could increase the likelihood of future inflation risks. This assertion comes even though traditional measures such as the output gap and the augmented Phillips curve have not proven particularly accurate in predicting inflation trends so far. The US economy is currently showing limited signs of slowing, contributing to continued capacity constraints. These continued restrictions may in turn maintain inflation risk potential, regardless of the temporary decline that occurred over the summer and in the third quarter.
Do you need help in finding the best crypto exchange for your needs?
Click here: The Best Crypto Exchange Finder
Disclaimer:
Please note that this article serves solely for informational purposes. As such, it is not financial advice. We strongly advise readers to conduct thorough research and consult with financial professionals before making any investment decisions.


